
Introduction
Data transformation is a critical task for data analysts, enabling the extraction of valuable insights from raw data. One essential aspect of data transformation in Power BI is transposing data. This guide will explore how to transpose data in Power BI using the Power Query Editor, with practical examples and script snippets, tailored for data analysts.
What is Transposing Data?
Transposing data involves converting rows to columns and columns to rows. This technique is often used to reorient data for better analysis and visualization. For example, transposing a table with monthly sales data where months are in rows and sales amounts are in columns can make it easier to compare monthly sales figures.
Importance of Transposing Data
Transposing data allows data analysts to:
- Reorient data for better readability and analysis.
- Facilitate comparisons by aligning data in a preferred orientation.
- Simplify data modeling and visualization.
Step-by-Step Process for Transposing Data in Power BI
1. Loading Data into Power BI
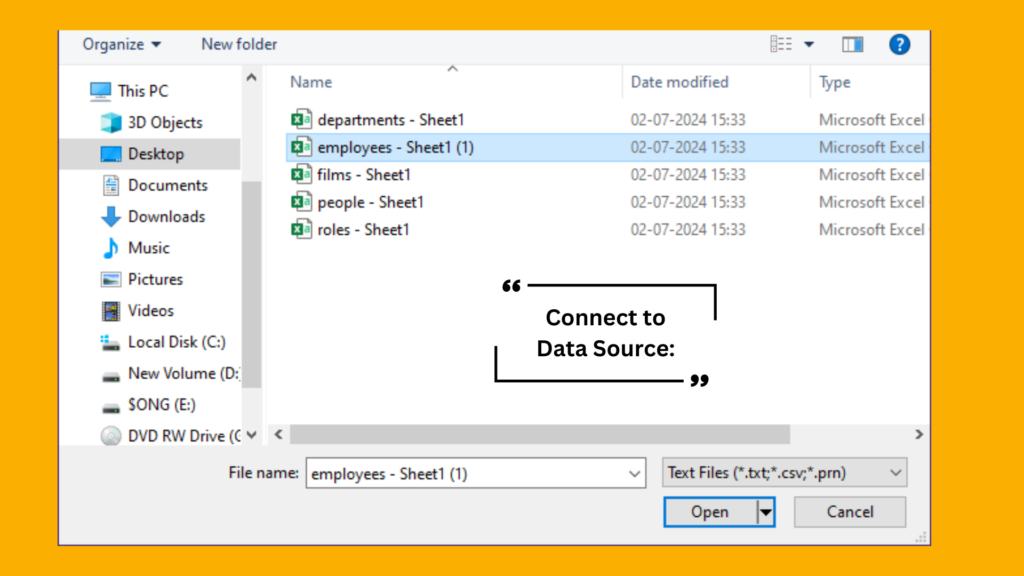
Begin by loading your dataset into Power BI. You can import data from various sources such as Excel, SQL databases, and web data.
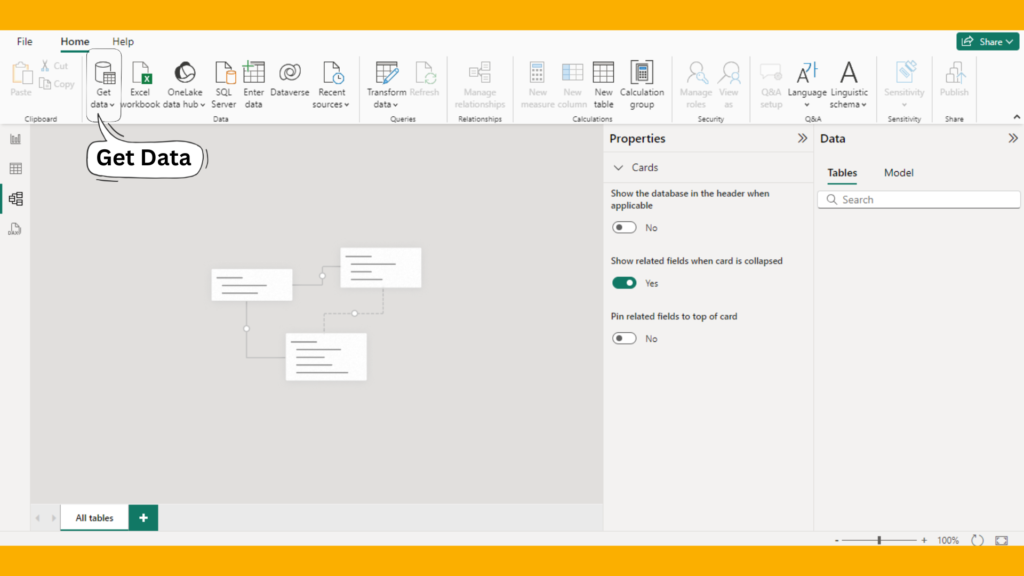
1. Open Power BI Desktop.

2.Click on Get Data from the Home ribbon.
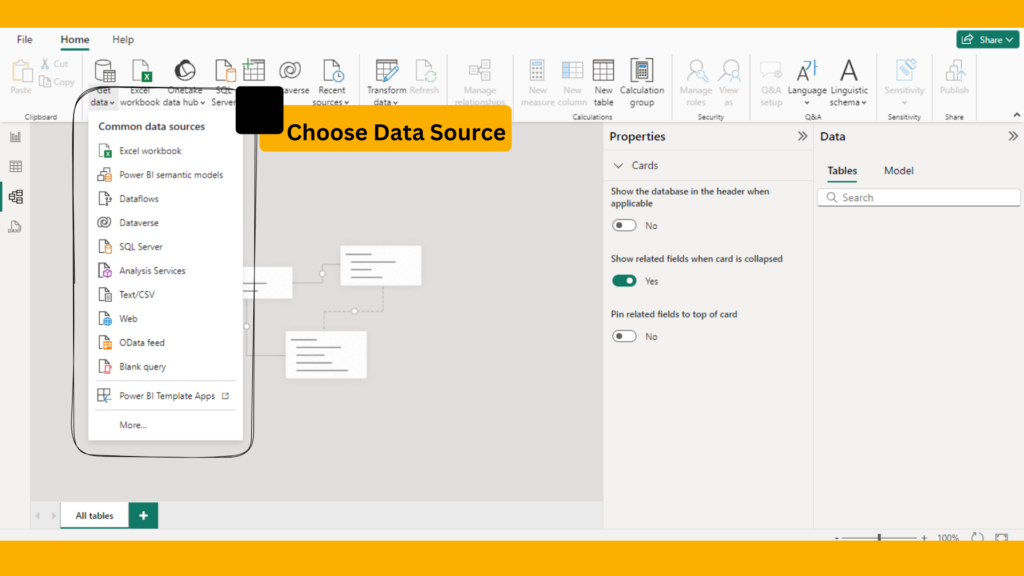
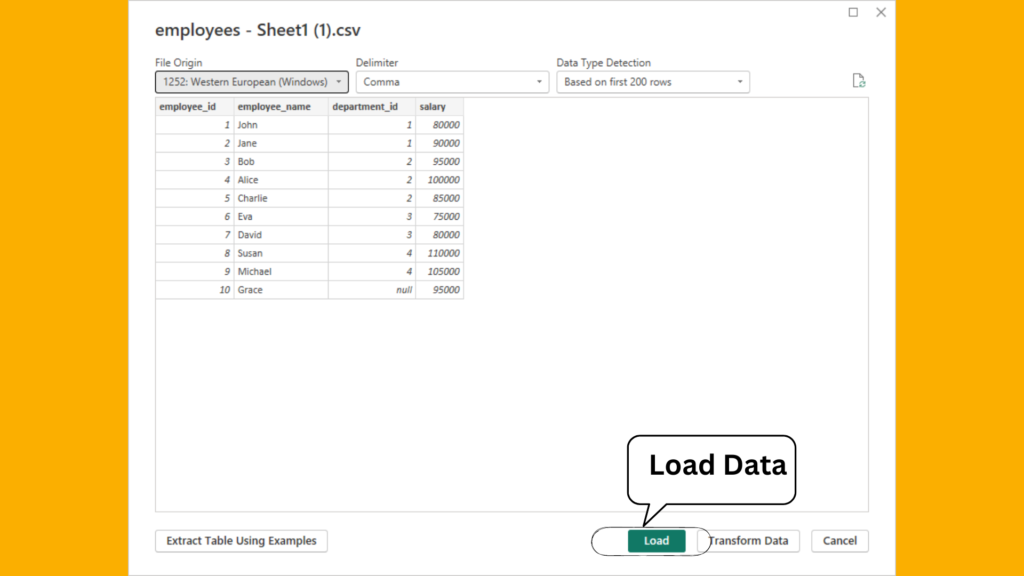
3. Select your data source and follow the prompts to load the data.
2. Opening the Power Query Editor
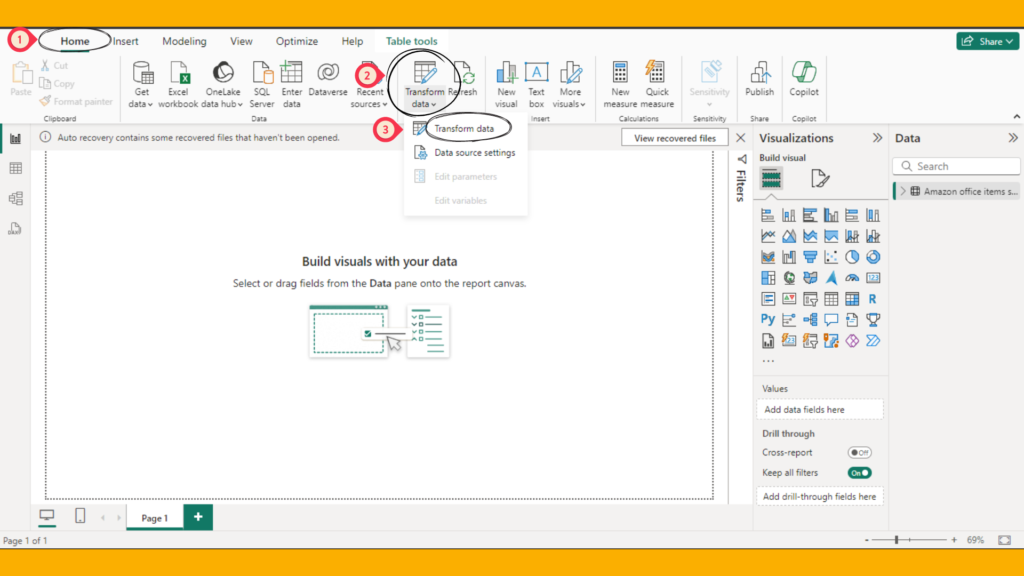
Once your data is loaded, access the Power Query Editor to start creating new columns.
- In Power BI Desktop, navigate to the Home tab.
- Click on Transform Data to open the Power Query Editor.
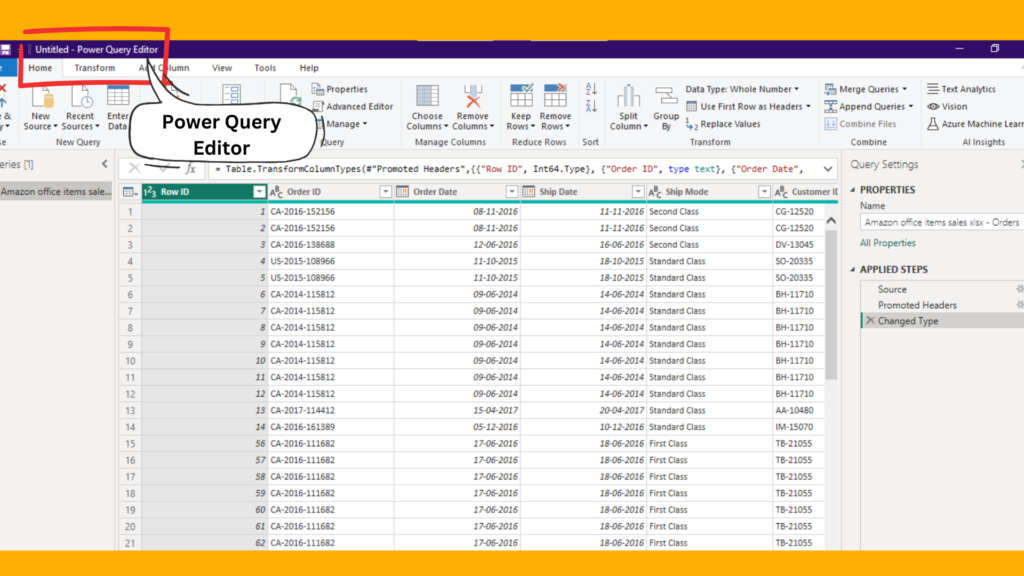
3. Transposing Data in Power Query Editor
In the Power Query Editor, you can transpose data using various techniques and options.
Example 1: Transposing a Simple Table
Suppose you have a table with monthly sales data where months are in rows and sales amounts are in columns. You want to transpose this table so that months are in columns and sales amounts are in rows.
- In the Power Query Editor, select the table you want to transpose.
- Go to the Transform tab.
- Click on Transpose.
let
    Source = <Your data source>,
    TransposedTable = Table.Transpose(Source)
in
TransposedTable4. Transposing with Headers
When transposing data, it’s essential to ensure that headers are correctly aligned. If your table has headers, you can promote them after transposing.
Example 2: Transposing Data with Headers
Assume you have a table with headers. You need to transpose the data and then promote the first row as headers.
- In the Power Query Editor, select the table you want to transpose.
- Go to the Transform tab.
- Click on Transpose.
- Go to the Home tab.
- Click on Use First Row as Headers.
let
    Source = <Your data source>,
    TransposedTable = Table.Transpose(Source),
    PromotedHeaders = Table.PromoteHeaders(TransposedTable, [PromoteAllScalars=true])
in
PromotedHeaders5. Transposing and Unpivoting Data
Transposing can be combined with unpivoting to reshape data for specific analysis needs.
Example 3: Transposing and Unpivoting Monthly Sales Data
Assume you have a table with monthly sales data in columns. You want to transpose and unpivot the data so that each row represents a month and its sales amount.
- In the Power Query Editor, select the table you want to transpose.
- Go to the Transform tab.
- Click on Transpose.
- Select the columns to unpivot.
- Go to the Transform tab.
- Click on Unpivot Columns.
let
    Source = <Your data source>,
    TransposedTable = Table.Transpose(Source),
    UnpivotedTable = Table.UnpivotOtherColumns(TransposedTable, {}, "Attribute", "Value")
in
UnpivotedTableConclusion
Transposing data in Power BI is a powerful technique for data analysts. Whether through simple transposition, handling headers, or combining with unpivoting, transposing data enables better readability, comparison, and analysis of datasets, enhancing the overall data transformation process.
Frequently Asked Questions
Transposing data converts rows to columns and columns to rows, reorienting the data. Unpivoting data transforms columns into attribute-value pairs, reshaping wide tables into long tables for better analysis.
Yes, you can transpose data with complex structures, but you may need to handle headers and other transformations carefully to ensure the data is correctly aligned and readable.
If you encounter errors when transposing data, check the following:
Ensure the table structure is consistent and has no missing values.
Validate your transpose and transformation steps for syntax errors.
Use the Error and Query Dependencies views in the Power Query Editor to identify and resolve issues.
