
Introduction
Data transformation is a critical task for data analysts, enabling the extraction of valuable insights from raw data. One essential aspect of data transformation in Power BI is using count functions. This guide will explore how to use count functions in Power BI using the Power Query Editor, with practical examples and script snippets, tailored for data analysts.
What are Count Functions?
Count functions are used to count the number of rows or the number of specific values in a column within a dataset. These functions are vital for summarizing and analyzing data. For example, counting the number of sales transactions or the number of unique customers can provide essential insights into business performance.
Importance of Count Functions
Count functions allow data analysts to:
- Summarize data to gain insights quickly.
- Perform aggregate analysis to understand data distribution.
- Support decision-making with precise data metrics.
Step-by-Step Process for Using Count Functions in Power BI
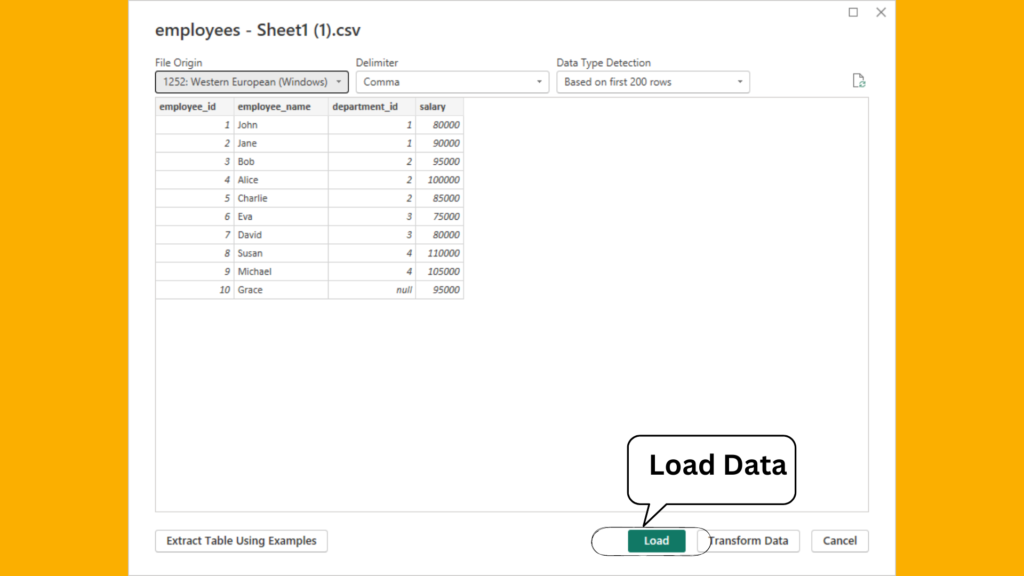
1. Loading Data into Power BI
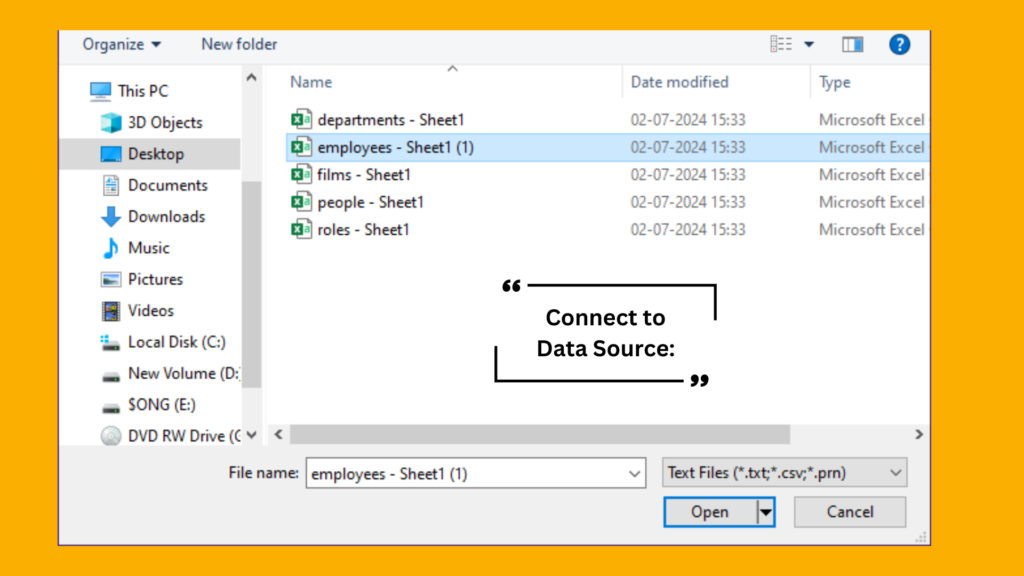
Begin by loading your dataset into Power BI. You can import data from various sources such as Excel, SQL databases, and web data.
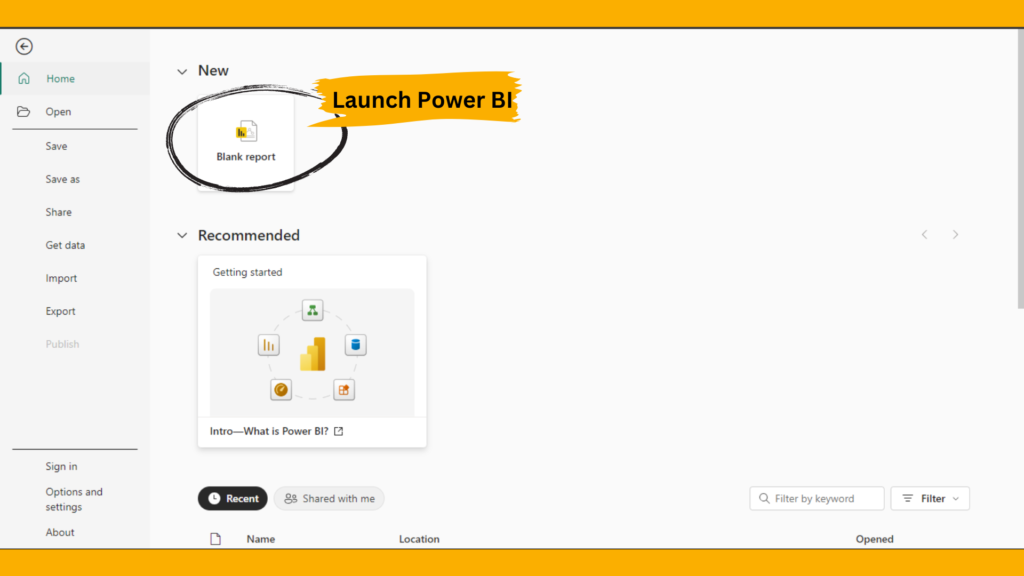
1. Open Power BI Desktop.
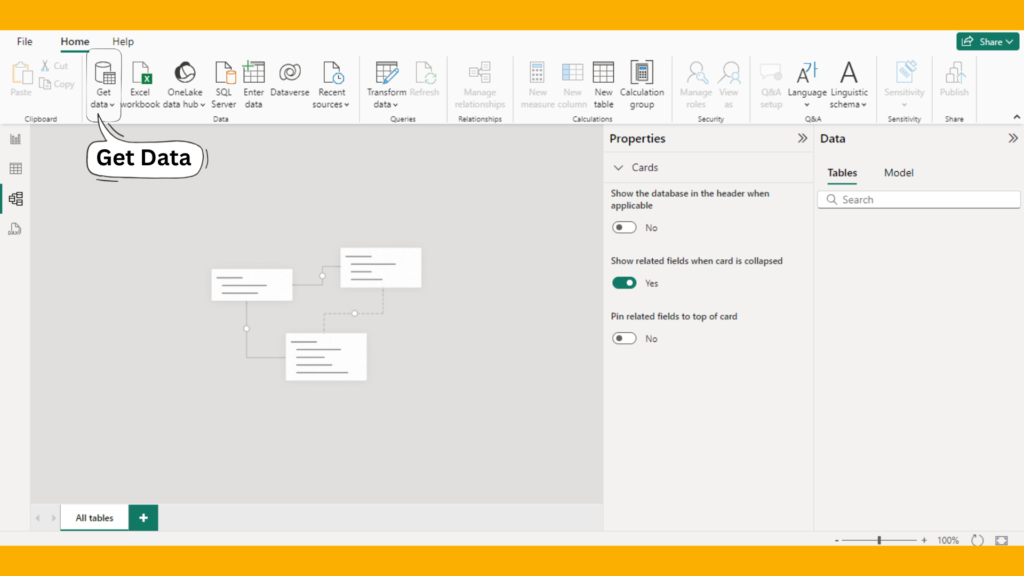
2. Click on Get Data from the Home ribbon.
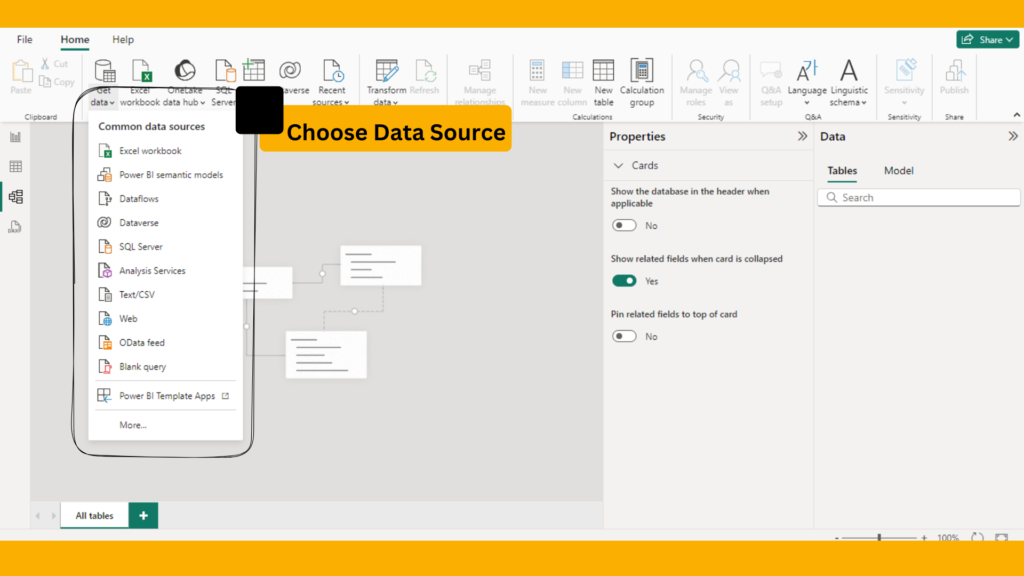
3. Select your data source and follow the prompts to load the data.
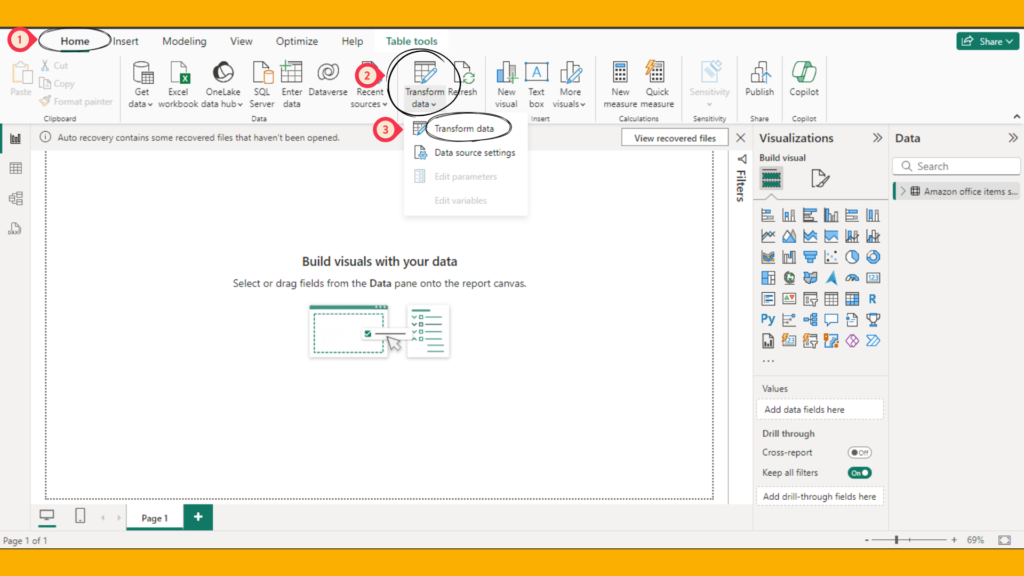
2. Opening the Power Query Editor
Once your data is loaded, access the Power Query Editor to start creating new columns.
- In Power BI Desktop, navigate to the Home tab.
- Click on Transform Data to open the Power Query Editor.
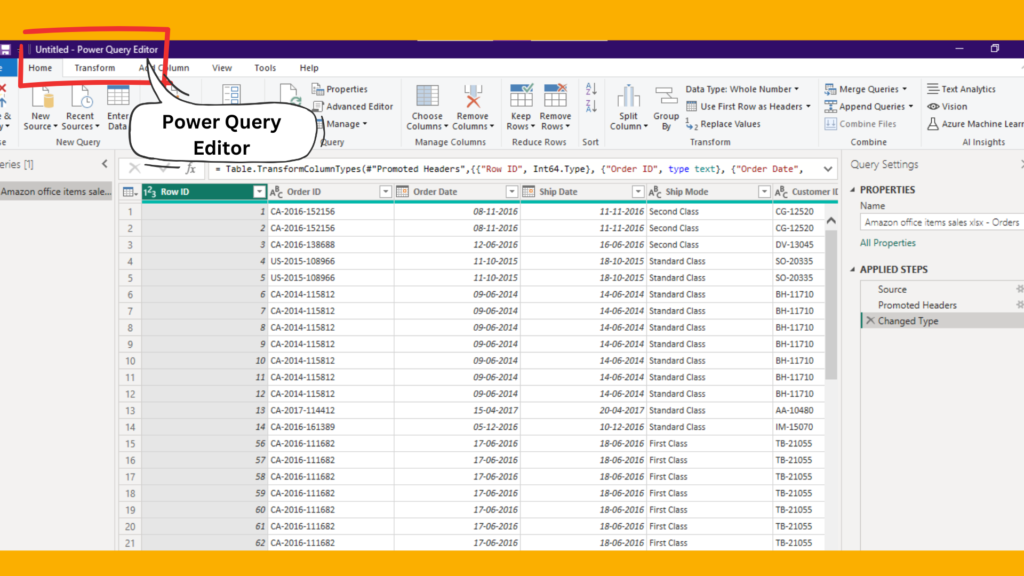
3. Using Count Functions in Power Query Editor
In the Power Query Editor, you can use various count functions to analyze your data.
Example 1: Counting Rows
Suppose you have a table with sales transactions, and you want to count the total number of transactions.
- In the Power Query Editor, select the table you want to analyze.
- Go to the Transform tab.
- Click on Count Rows.
Example 2: Counting Specific Values
Assume you want to count the number of transactions for a specific product.
- In the Power Query Editor, select the table you want to analyze.
- Go to the Transform tab.
- Click on Group By.
- In the Group By window, select the column containing product names.
- Add an aggregation with the operation set to Count Rows.
4. Counting Unique Values
Counting unique values helps in identifying distinct entries in a column.
Example 3: Counting Unique Customers
Assume you want to count the number of unique customers in your sales data.
- In the Power Query Editor, select the table you want to analyze.
- Go to the Add Column tab.
- Click on Index Column to add a unique identifier to each row.
- Go to the Transform tab.
- Click on Group By.
- In the Group By window, select the customer column and set the operation to Count Distinct Rows.
Conclusion
Using count functions in Power BI is a powerful technique for data analysts. Whether counting rows, specific values, or unique values, count functions enable quick summarization and analysis of datasets, enhancing the overall data transformation process.
Frequently Asked Questions
Table.RowCount and Table.Group in Power BI? Table.RowCount counts the total number of rows in a table, while Table.Group groups rows based on a specified column and can perform aggregations like counting rows within each group.
Yes, you can use the Table.Group function with custom aggregations to count rows based on multiple conditions. This allows you to perform complex data analysis.
If you encounter errors when using count functions, check the following:
Ensure the table structure is consistent and has no missing values.
Validate your count and transformation steps for syntax errors.
Use the Error and Query Dependencies views in the Power Query Editor to identify and resolve issues.
