
Introduction
Pivot tables are powerful tools in Excel that enable users to summarise, analyse, and manipulate large datasets efficiently. Whether you’re a beginner or an advanced user, understanding pivot tables and their capabilities can significantly enhance your data analysis skills. This comprehensive guide will walk you through everything you need to know about data summarization using pivot tables, including detailed explanations of query functions and various pivot table functionalities.
Understanding Pivot Tables
What are Pivot Tables?
Pivot tables are interactive tables in Excel that allow you to summarise and analyse large datasets. They provide a flexible way to rearrange and aggregate data dynamically without complex formulas.
Key Benefits of Pivot Tables:
- Summarization: Quickly summarise large datasets into concise, meaningful reports.
- Analysis: Analyse data by different categories, such as product, region, or time.
- Visualisation: Create charts and graphs based on pivot table summaries for visual representation of data trends.
Creating a Pivot Table
Step-by-Step Guide to Creating a Pivot Table:
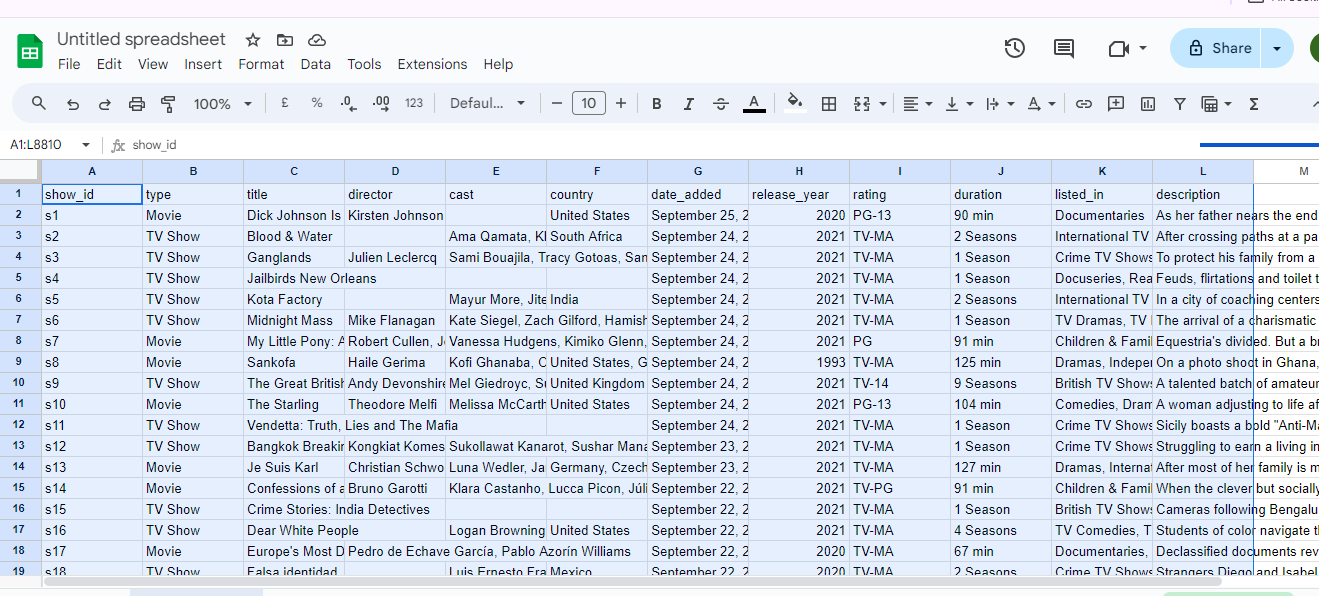
- Select Your Data: Highlight the dataset you want to analyse.
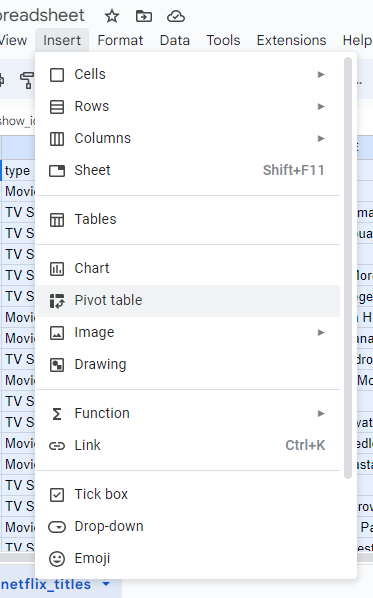
- Insert Pivot Table: Go to the Insert tab, click on PivotTable, and choose the data range.

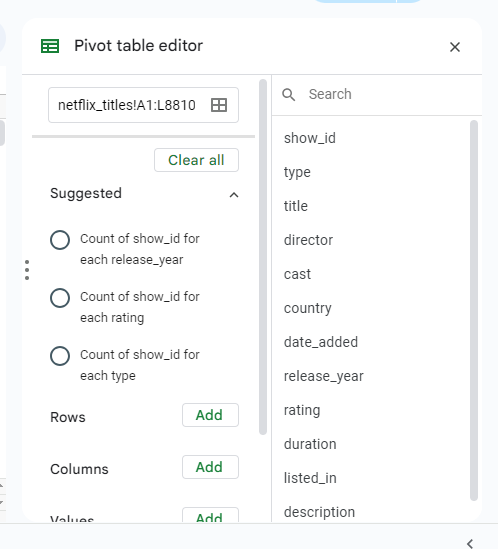
- Configure Your Pivot Table: Drag fields into the Rows, Columns, Values, and Filters areas to organise and summarise your data.
Query Functions for Advanced Data Analysis
Using QUERY Function:
The QUERY function in Excel allows you to retrieve specific data from a dataset based on defined criteria, similar to SQL queries.
- Syntax: =QUERY(data, query, [headers])
- Example: =QUERY(A1:E100, “SELECT A, SUM(E) WHERE B = ‘Category 1’ GROUP BY A LABEL A ‘Product’, SUM(E) ‘Total Sales’”, TRUE)
Key Features of QUERY Function:
- Filtering: Retrieve data based on specific conditions using WHERE clause.
- Aggregation: Summarise data with SUM, COUNT, or other aggregate functions.
- Grouping: Group data by specific fields with GROUP BY clause.
Different Types of Pivot Table Functions
1. Summarising Data:
- Sum: Adds numeric values together.
- Count: Counts the number of entries in a field.
- Average: Calculates the average of numeric data.
- Min/Max: Finds the minimum or maximum value in a field.
2. Calculated Fields and Items:
- Calculated Fields: Create new fields with custom formulas based on existing data.
- Calculated Items: Apply calculations within existing fields.
3. Sorting and Filtering:
- Sorting: Arrange data in ascending or descending order.
- Filtering: Display specific data subsets using filters.
4. Pivot Charts and Conditional Formatting:
- Pivot Charts: Create visual representations of pivot table data.
- Conditional Formatting: Highlight cells based on specified conditions for better data visualisation.
Advanced Pivot Table Techniques
1. Slicers and Timelines:
- Slicers: Interactive filters to slice and dice data dynamically.
- Timelines: Filter date-based data easily with interactive timelines.
2. Grouping and Ungrouping Data:
- Grouping: Combine data into manageable groups, e.g., by month or quarter.
- Ungrouping: Expand grouped data back to its original detail level.
3. Data Drill-Down:
- Drill Down: Double-click on summarised data to view underlying details, aiding in root cause analysis.
Best Practices for Pivot Table Usage
1. Data Preparation:
- Ensure data is clean, organised, and free from errors before creating pivot tables.
2. Dynamic Updates:
- Pivot tables update automatically when source data changes, ensuring analysis remains current.
3. Formatting and Visualization:
- Use pivot charts, colours, and conditional formatting to enhance data presentation and readability.
Conclusion
Pivot tables are indispensable tools for data summarization and analysis in Excel, offering robust functionalities to explore and derive insights from complex datasets. By mastering pivot tables, you can streamline data analysis tasks, uncover trends, and make informed decisions based on comprehensive data summaries. Whether you’re analysing sales figures, tracking project progress, or evaluating performance metrics, pivot tables provide a versatile framework for transforming raw data into actionable insights.
Frequently Asked Questions
Select your dataset, go to the Insert tab, click on PivotTable, and follow the prompts to configure your pivot table.
Yes, pivot tables are designed to process and summarise large datasets efficiently, provided the data is well-structured.
Advanced features include calculated fields, pivot charts, slicers, timelines, and conditional formatting.
