
What is Power BI?
Power BI is a suite of business analytics tools that deliver insights throughout your organization. It connects to hundreds of data sources, simplifies data preparation, and drives ad hoc analysis. With Power BI, you can produce beautiful reports, publish them for your organization to consume on the web and across mobile devices, and integrate them with other Microsoft products.
What Does “BI” in Power BI Stand For?
“BI” stands for Business Intelligence. Business Intelligence refers to the technologies, applications, and practices for the collection, integration, analysis, and presentation of business information. The purpose of BI is to support better business decision-making.
Who Uses Power BI?
Power BI is used by a wide range of professionals, including data analysts, business analysts, IT professionals, and managers. It is also utilized by various industries such as finance, marketing, sales, human resources, and operations to visualize and analyze their data.
Why Power BI?
Components And Building Blocks of Power BI
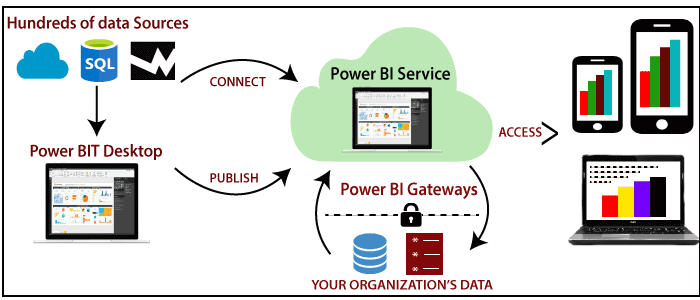
In order to create reports with Power BI, you must first understand the tools necessary. There are three primary components to Power BI:
- Power BI Desktop (desktop application)
- Power BI service (online platform)
- Power BI Mobile (cross-platform mobile app)
Power BI Desktop is the development tool available to data analysts and other report creators. While the Power BI service allows you to organize, manage, and distribute your reports and other Power BI items. Power BI Desktop is available to download for free either through the Windows store or directly online.
You can access the Power BI service with a school or work account. If your organization doesn’t already use Power BI, you can still explore the service by getting a free trial or signing up for a free Microsoft 365 Developer account.
Power BI Mobile allows consumers to view reports in a mobile-optimized format. You can create these optimized report views in Power BI Desktop.
Building Blocks Of Power BI:
- Visualization
- Datasets
- Reports
- Dashboards
- Tiles
Power BI Flow
The typical flow in Power BI involves the following steps:
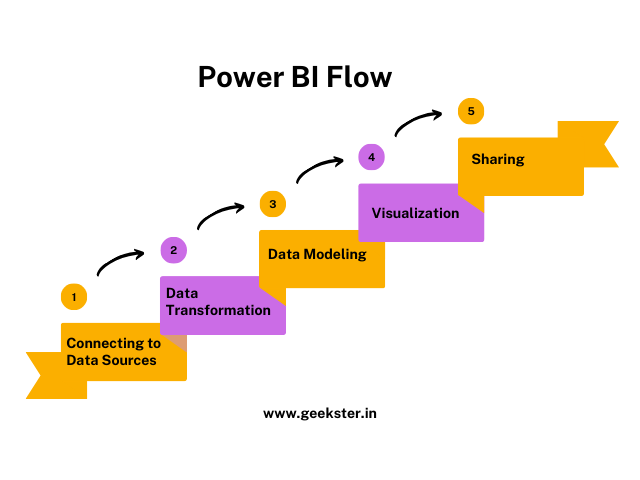
- Connecting to Data Sources: Importing data from various sources such as databases, Excel files, cloud services, etc.
- Data Transformation: Using Power Query Editor to clean and transform the data.
- Data Modeling: Creating relationships between different data sets.
- Visualization: Creating interactive reports and dashboards using various visualization tools.
- Sharing: Publishing and sharing the reports with others in your organization.
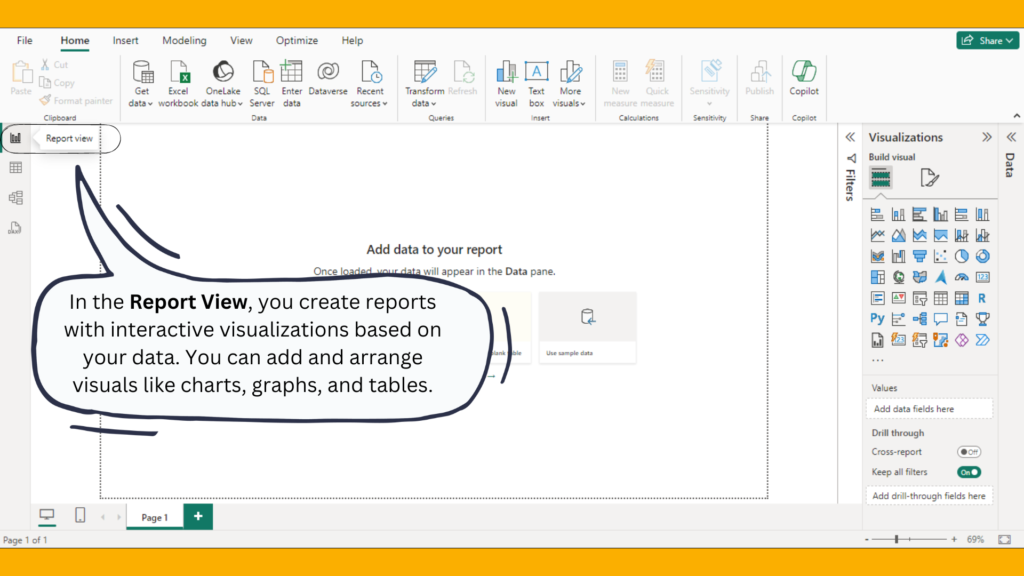
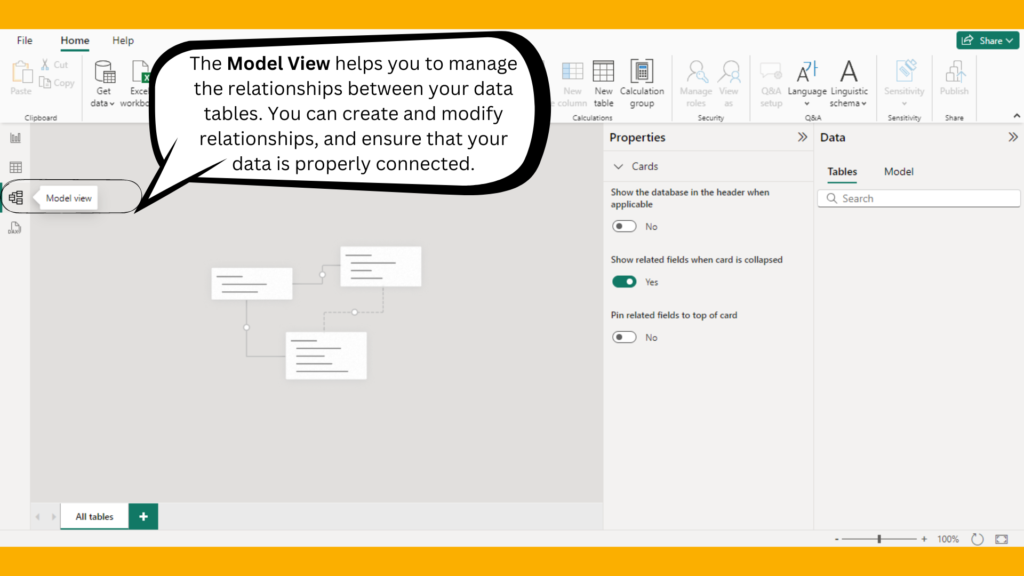
Different Views In Power BI
Report View
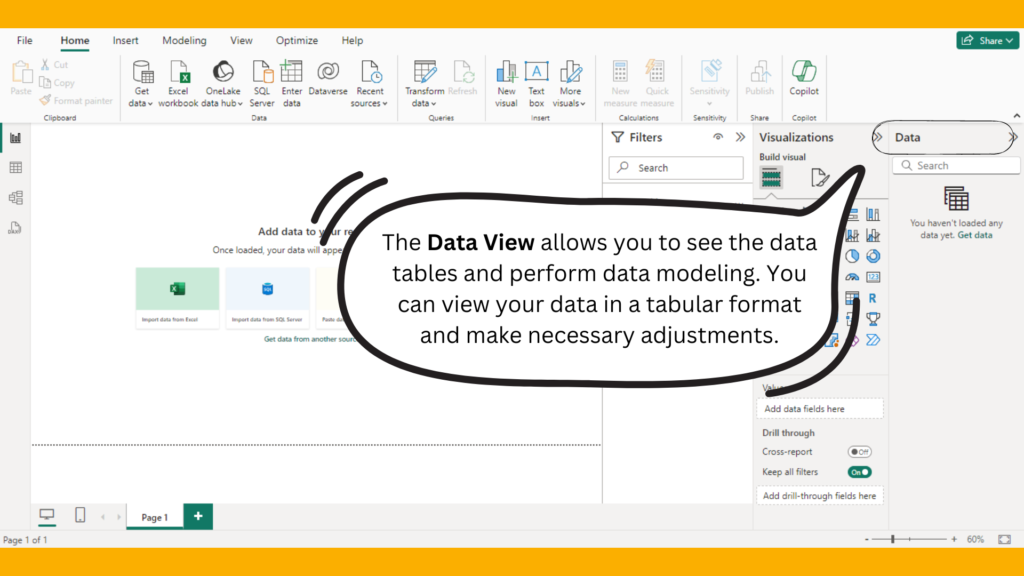
Data View
Model View
Importing Data in Power BI
File Formats for Importing Data
Power BI supports various file formats for importing data, including:
- Excel (.xlsx, .xlsm)
- CSV (.csv)
- XML (.xml)
- JSON (.json)
- PDF (.pdf)
- SQL Server database
- Azure SQL database
- Web data
- OData feed
Getting Data from Various Sources in Power BI
One of Power BI’s strongest features is its ability to connect to a wide variety of data sources. This flexibility allows you to bring all your data together, regardless of where it resides.
Steps to Get Data in Power BI:
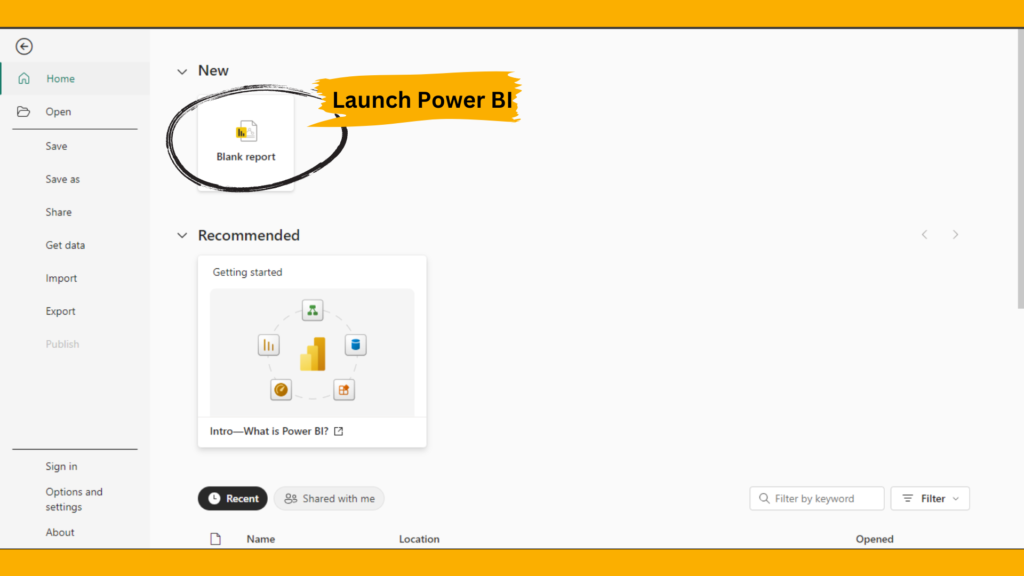
Launch Power BI: Open Power BI Desktop.
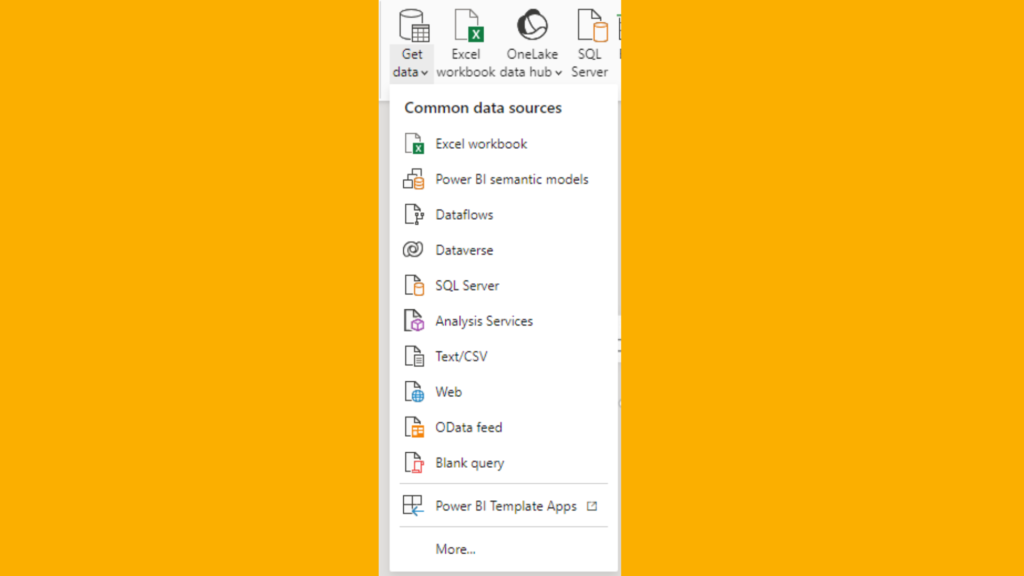
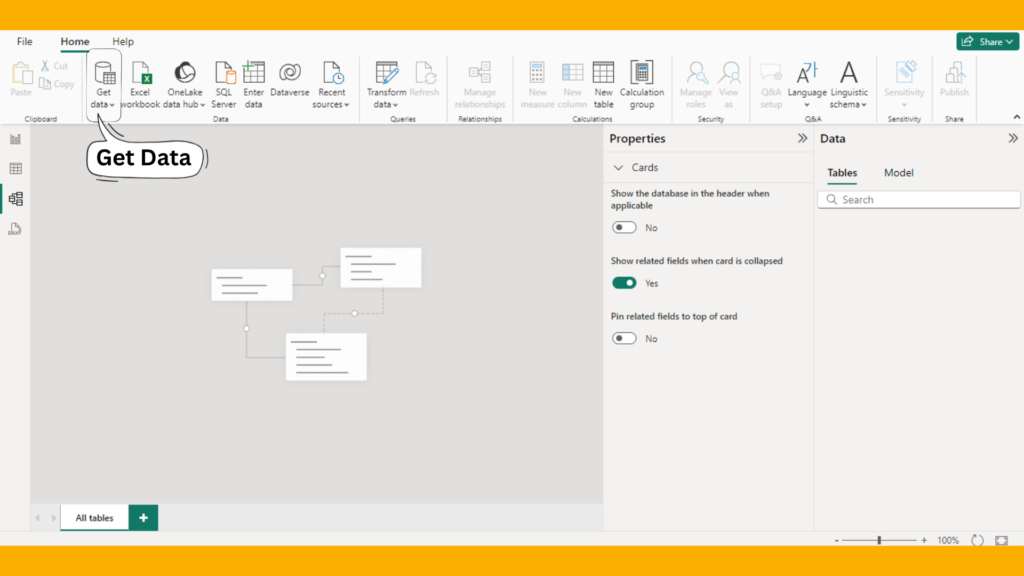
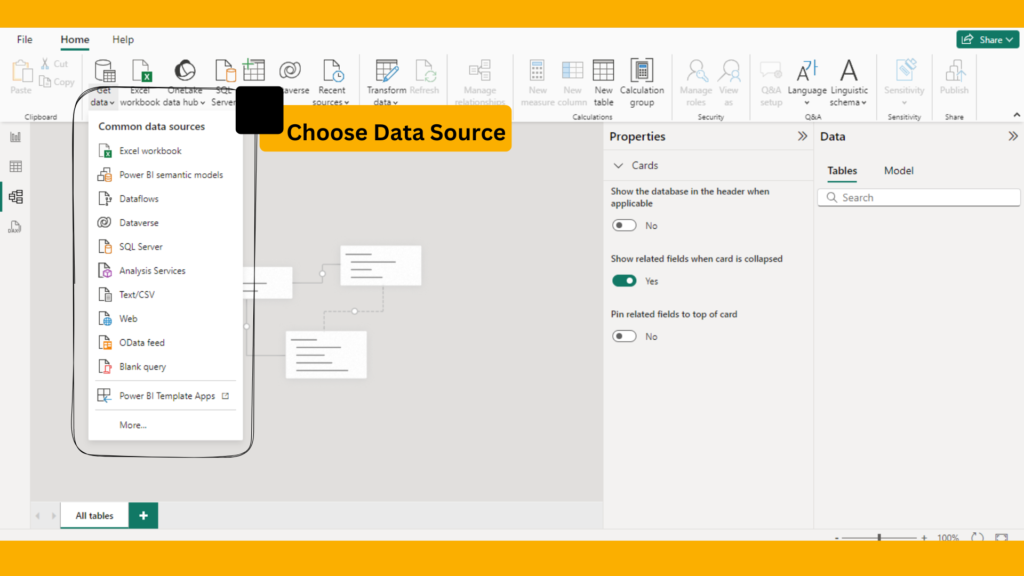
Get Data: Click on the “Home” tab and then click “Get Data.”
Choose Data Source: Select the type of data source you want to connect to. For Example: Click “Get Data” and select “CSV”. Power BI supports a wide range of sources, including:
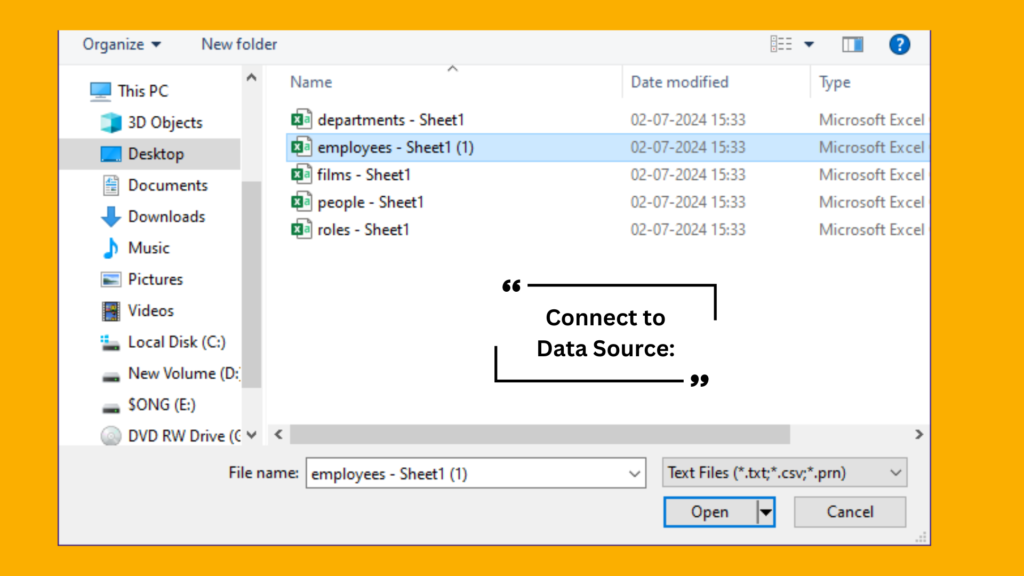
Connect to Data Source: Enter the required connection details, such as server name, database name, or URL. Browse to the location of your Excel file and select it.
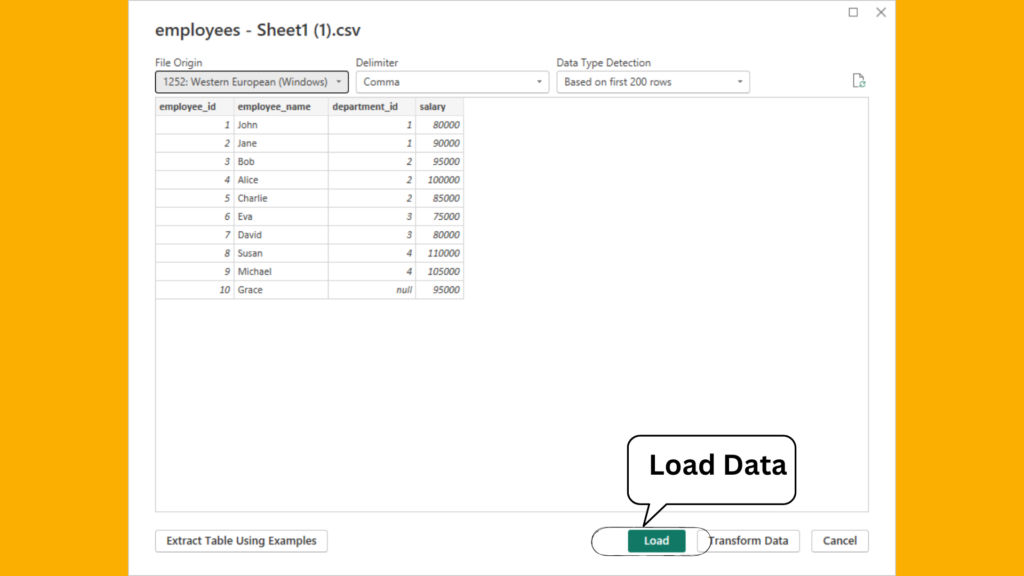
Load Data: Preview the data and click “Load” to import it into Power BI. Preview the data and select the sheets or tables you want to import. Click “Load” to import the data into Power BI.
This is what you will see once the data is loaded.
Power Query Editor
Power Query Editor is a powerful tool in Power BI that allows you to clean, transform, and reshape your data before loading it into your data model. Some common data transformation tasks include:
- Removing duplicates
- Filtering rows
- Changing data types
- Merging queries
- Creating custom columns
Types of Data that Can Be Loaded, Transformed, and Uploaded/Cancelled in Power BI
- Structured data (e.g., Excel files, SQL databases)
- Semi-structured data (e.g., JSON, XML)
- Unstructured data (e.g., text files, PDFs)
Conclusion
Power BI is an essential tool for anyone involved in data analysis and business intelligence. It provides robust capabilities for connecting to various data sources, transforming data, creating interactive visualizations, and sharing insights across an organization. By mastering Power BI, you can turn raw data into actionable insights, driving better business decisions.
Frequently Asked Questions
Power BI offers several licensing options, including Power BI Free, Power BI Pro, and Power BI Premium. Each license type has different features and capabilities.
Yes, Power BI can handle real-time data by using streaming datasets. This allows you to monitor real-time data and create dashboards that update automatically.
Power BI provides robust security features, including data encryption, role-based access control, and integration with Microsoft Azure Active Directory for user authentication and authorization.
