
What is Data Analysis?
Data is basic information, and analyzing data means systematically interpreting and transforming that information into valuable insights. In today’s world, analysis involves using math, statistics, or computer methods to find patterns, trends, and connections in data sets. Data analysis is the process of looking closely at data, cleaning it up if needed, changing it if needed, and building models to find useful information, draw conclusions, and make decisions. It uses different techniques and tools to find important insights from raw data, helping us see patterns, trends, and relationships within the data.
Data Analysis Tools
Spreadsheet Software
Microsoft Excel
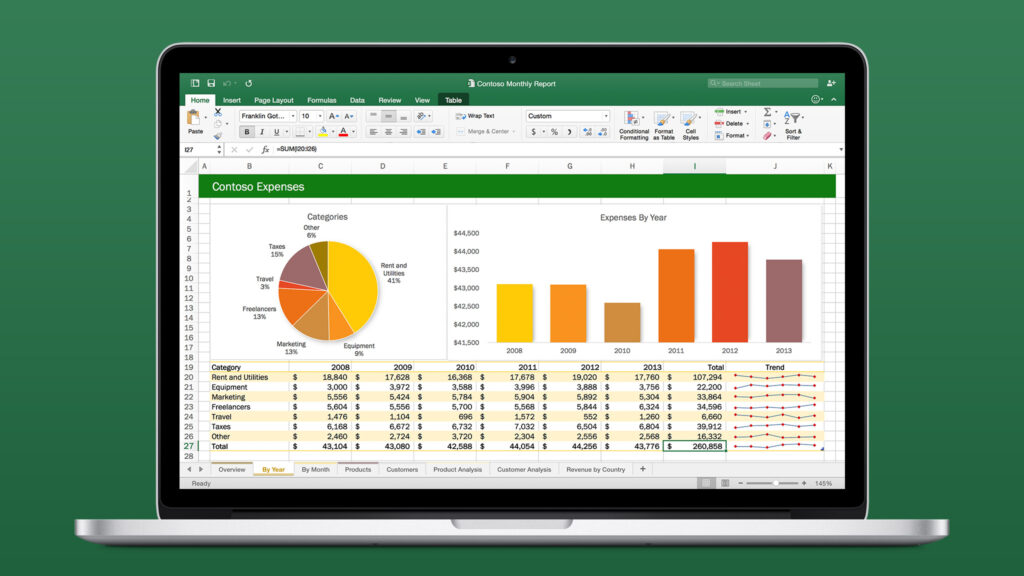
Microsoft Excel is a widely-used spreadsheet software that allows data analysts to organize, format, and calculate data. Excel provides various functionalities such as pivot tables, charts, and data visualization tools, making it a staple in the data analysis toolkit.
Google Sheets
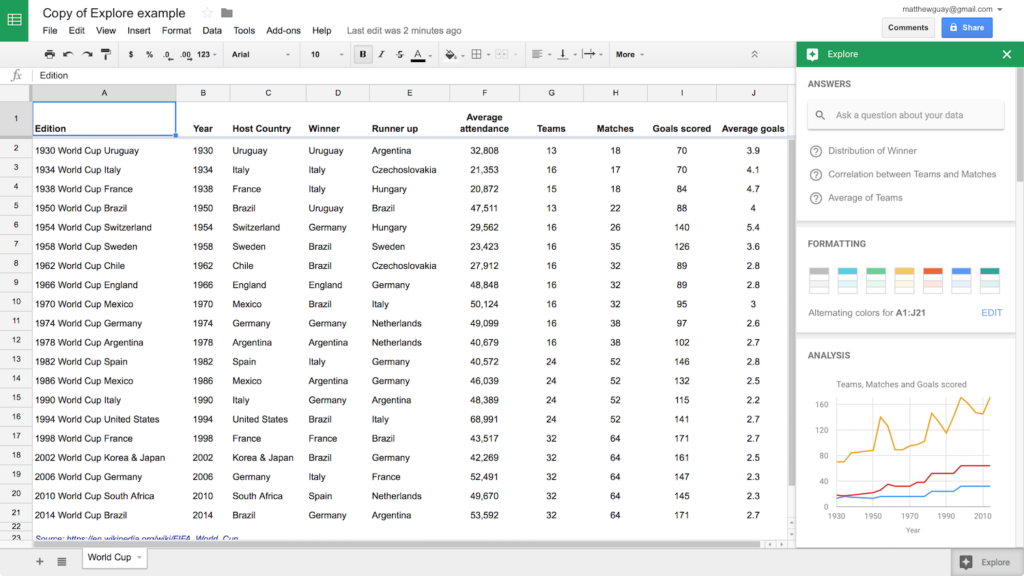
Google Sheets is a web-based spreadsheet application that offers similar functionalities to Excel. Its real-time collaboration features make it an excellent choice for teams working together on data analysis projects.
Statistical Analysis Tools
R
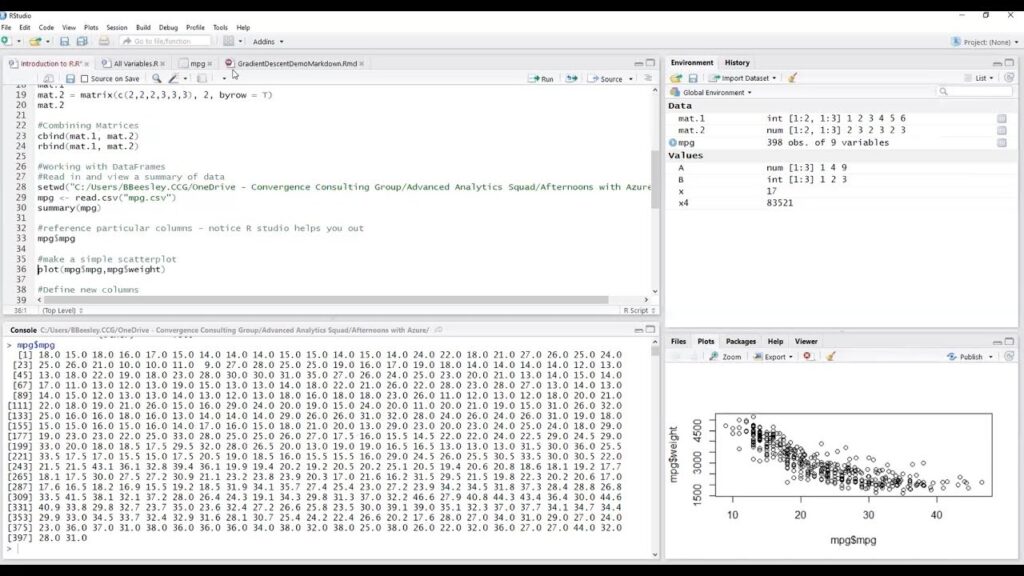
R is a programming language used widely for statistical computing and data analysis, making it a valuable tool for analyzing data. It’s known for handling large datasets well and being flexible. R’s package library offers various tools for tasks such as data manipulation and visualization. It also includes packages for activities like cleaning data, machine learning, and natural language processing, which adds to its capabilities.
However, R does have its drawbacks. It tends to run slower than languages like C++ and Java because R is interpreted rather than compiled. Additionally, R can be challenging to learn, especially if you’re new to programming, due to its steep learning curve.
SAS
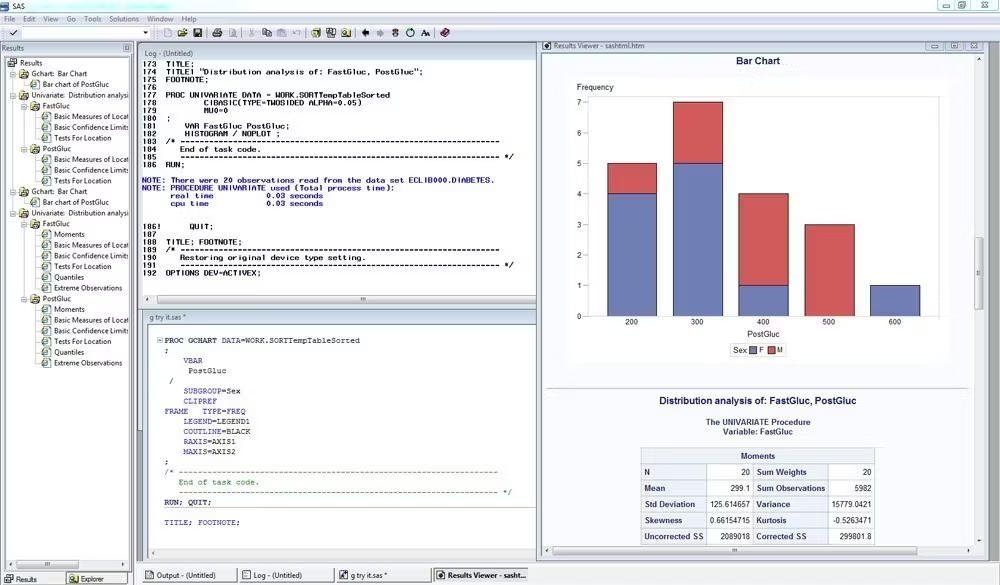
SAS stands for Statistical Analysis System, and it’s software developed by the SAS Institute. It’s popular for business analytics today. SAS offers both a graphical interface and a command-line interface, so users can pick whichever they’re comfortable with. It’s good at handling big datasets and comes with many analytical tools for various uses.
Programming Languages
Python
Python is a versatile programming language that is popular among data analysts due to its simplicity and extensive libraries like Pandas, NumPy, and SciPy for data manipulation and analysis. Additionally, visualization libraries like Matplotlib and Seaborn make it easy to create detailed graphs and charts.
SQL
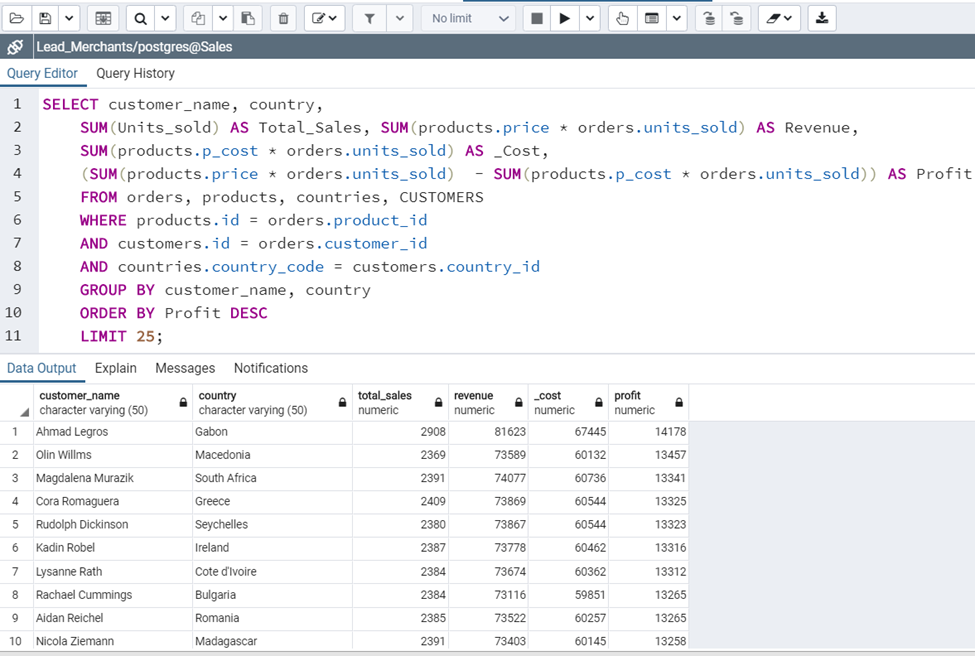
SQL (Structured Query Language) is the standard language for querying and managing databases. Data analysts use SQL to extract, manipulate, and analyze data stored in relational database management systems (RDBMS) such as MySQL, PostgreSQL, and Microsoft SQL Server.
Data Visualization Tools
Tableau
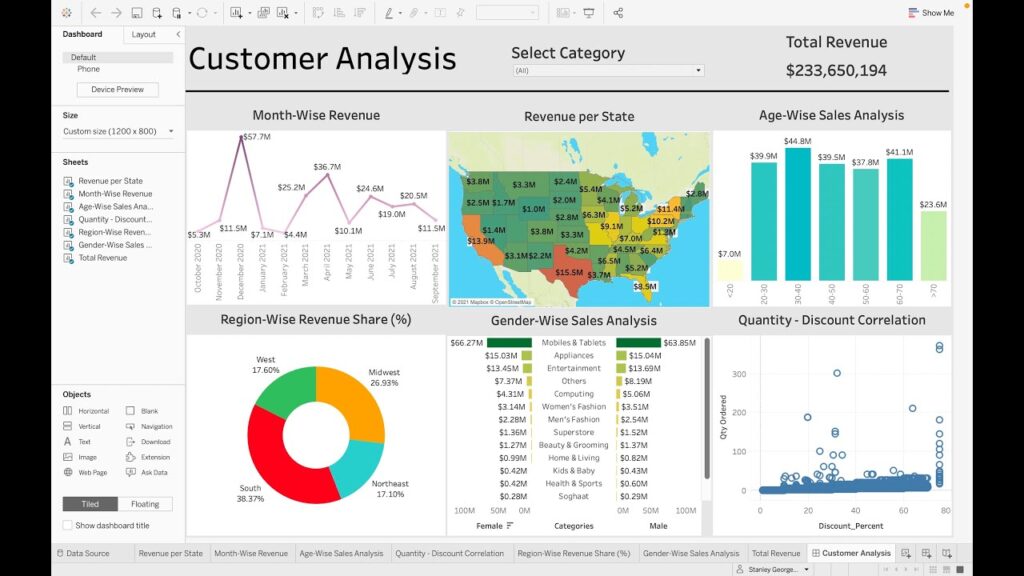
Tableau is a user-friendly tool for analyzing data. It lets you drag and drop items to make interactive charts and dashboards. Organizations can use it to quickly make visuals that explain the data clearly. Because it’s simple to use, anyone can use Tableau, even if they aren’t very technical. It also has lots of features and tools to help you make great visuals that are easy to understand.
Power BI
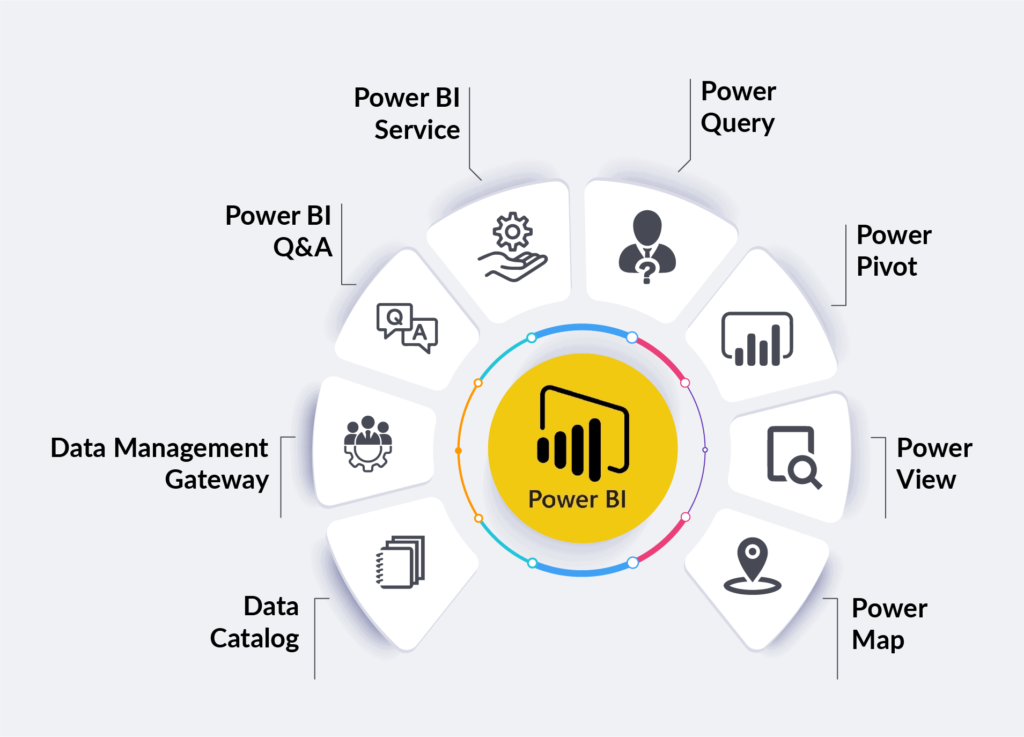
Microsoft Power BI is a business analytics tool that provides interactive visualizations and business intelligence capabilities with an interface simple enough for end-users to create their reports and dashboards.
Business Intelligence Tools
QlikView
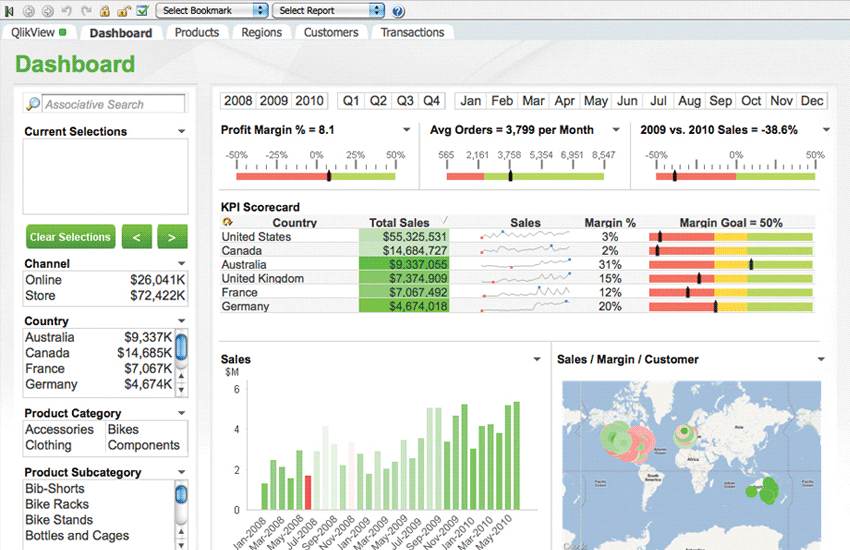
QlikView is a business intelligence platform that allows users to consolidate, search, and visually analyze data from multiple sources. Its associative data model and in-memory processing capabilities make it a powerful tool for data discovery and exploration.
Looker

Looker is a data platform that offers data analytics and business intelligence capabilities. It integrates seamlessly with various databases and provides a user-friendly interface for creating and sharing data reports.
Big Data Tools
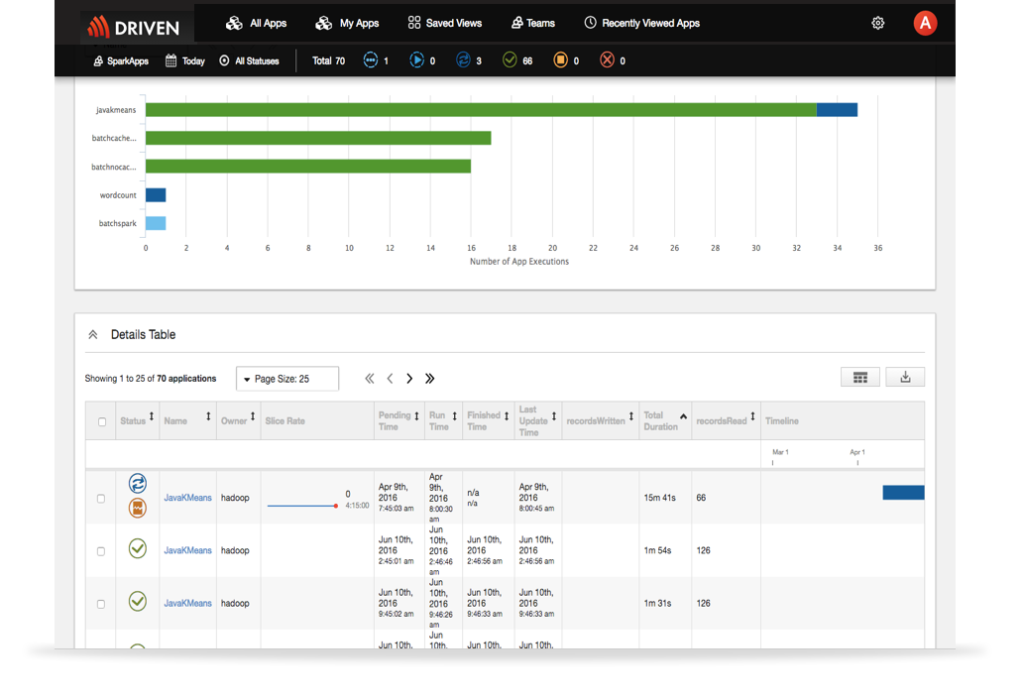
Apache Hadoop
Apache Hadoop is an open-source framework that allows for the distributed processing of large data sets across clusters of computers. It is designed to scale up from single servers to thousands of machines, offering a reliable and efficient way to handle big data.
Apache Spark
Apache Spark is a unified analytics engine for big data processing, with built-in modules for SQL, streaming, machine learning, and graph processing. It is known for its speed and ease of use, making it a popular choice for big data analytics.
Data Cleaning Tools
OpenRefine
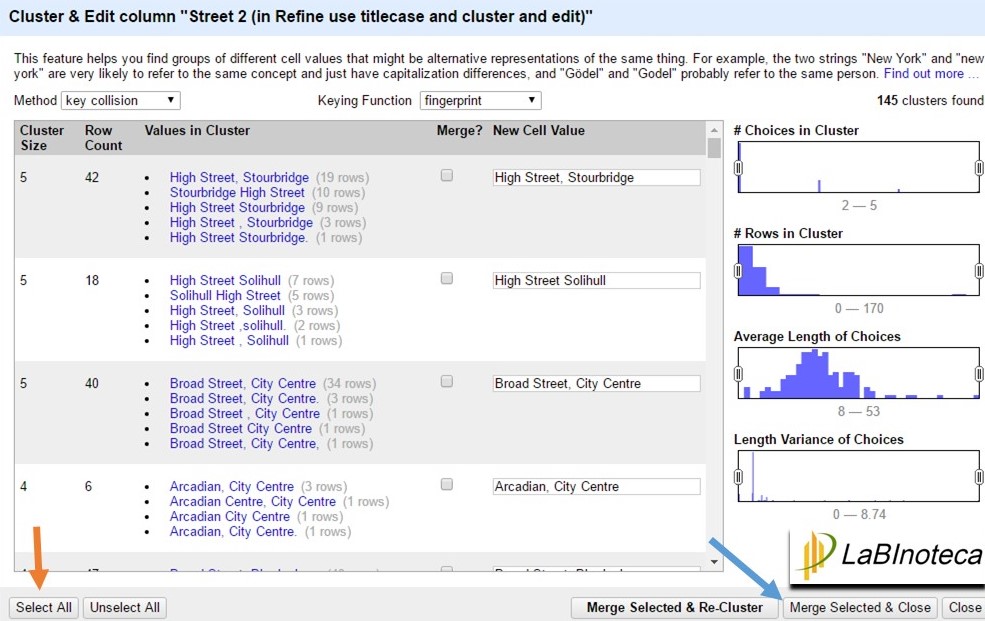
OpenRefine (formerly Google Refine) is a powerful tool for working with messy data: cleaning it, transforming it from one format into another, and extending it with web services and external data. It is an essential tool for data preparation and cleaning tasks.
Trifacta
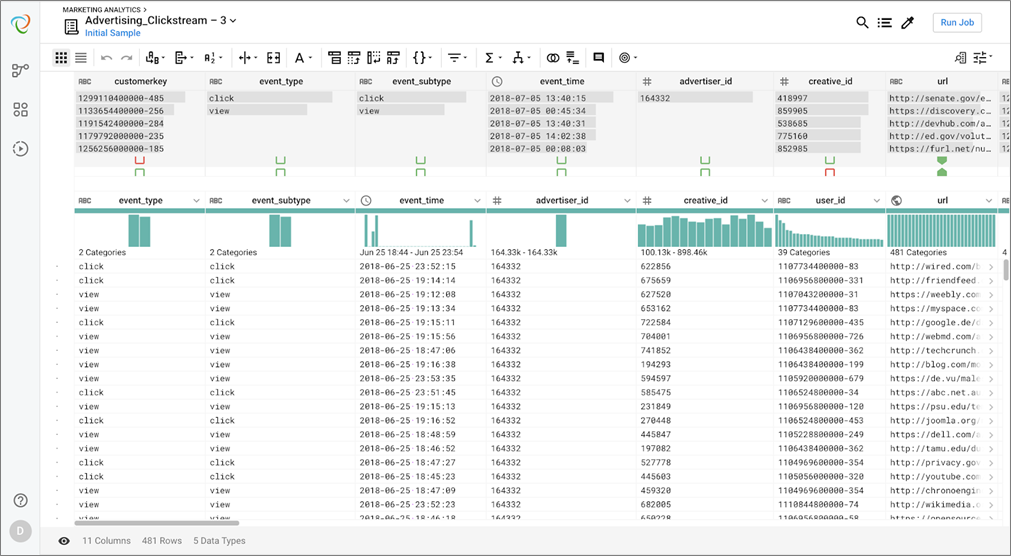
Trifacta is a data wrangling tool that helps analysts clean and transform raw data into clean and structured formats for analysis. Its intuitive interface and machine learning capabilities make data preparation faster and more efficient.
Conclusion
In conclusion, data analysis tools play a vital role in modern business and research environments, enabling organizations to extract valuable insights from raw data. These tools, ranging from user-friendly platforms like Tableau and Power BI for visualizing and interpreting data, to powerful programming languages like Python and R for statistical analysis and machine learning, cater to diverse analytical needs.
Each tool offers unique advantages and capabilities, such as interactive visualization, predictive modeling, and advanced statistical techniques, empowering users to make informed decisions and drive strategic initiatives. Moreover, the integration of machine learning libraries such as TensorFlow and SAS for handling complex datasets underscores the evolving landscape of data analytics.
Despite their strengths, each tool has its limitations, such as learning curves, computational efficiency, or scalability issues, which organizations should consider when selecting the right tool for their specific requirements.
In essence, data analysis tools serve as indispensable assets for leveraging data to enhance operational efficiency, optimize decision-making processes, and foster innovation across various sectors, ensuring competitive advantage and sustained growth in today’s data-driven world.
Frequently Asked Questions
Data analysis is the process of examining raw data with the goal of drawing conclusions about the information it contains. It involves cleaning, transforming, modeling, and interpreting data to uncover insights that inform decision-making.
Data analysis is crucial because it helps businesses and organizations make informed decisions based on evidence rather than intuition. It reveals patterns, trends, and relationships within data that can lead to improved strategies, increased efficiency, and better outcomes.
Machine learning algorithms automate the process of data analysis by identifying patterns and making predictions from data. They are used for tasks such as classification, clustering, and regression, enabling deeper insights and more accurate predictions.
